10X Trading Insights
Utilizing advanced mathematical methods for market predictions.
Live Alerts
Members receive real-time trading alerts to stay ahead in the market.
Price Visualization
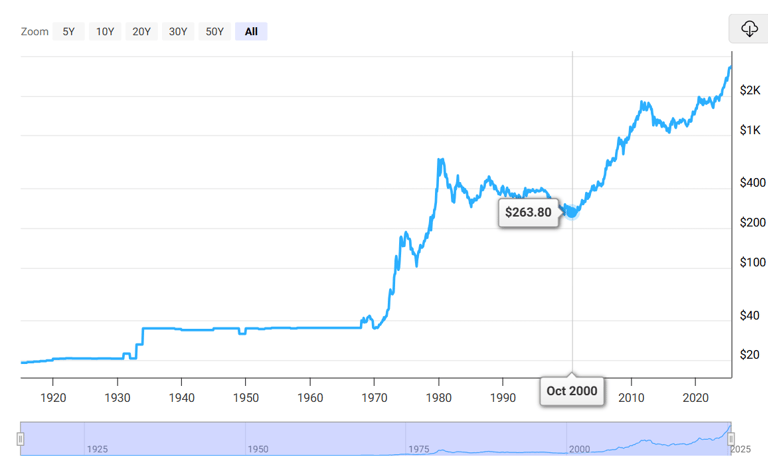
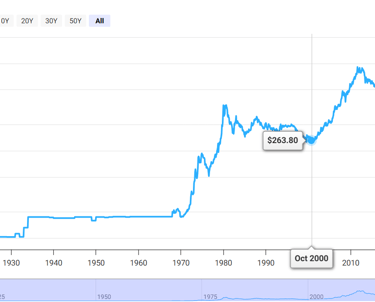
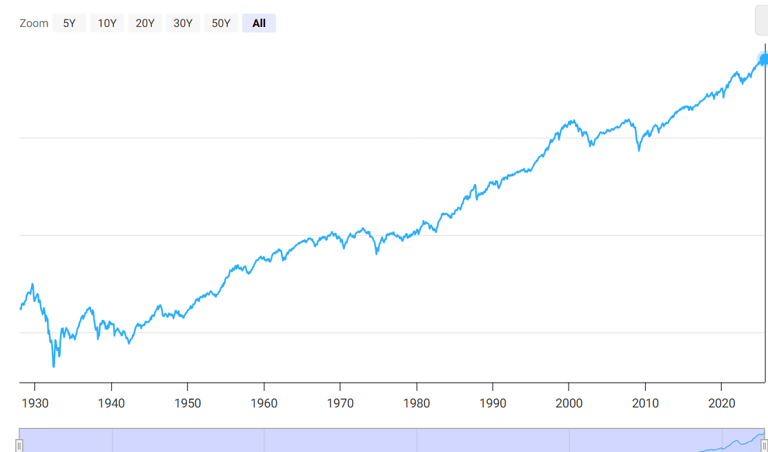
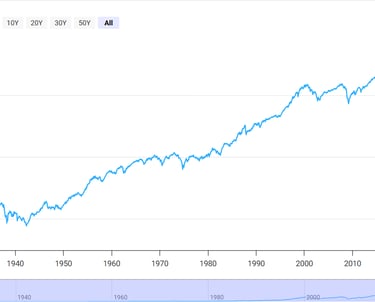
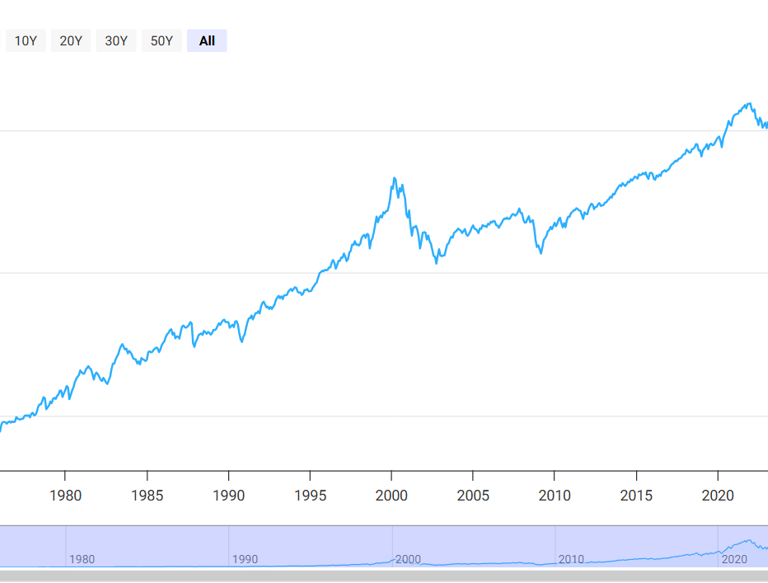
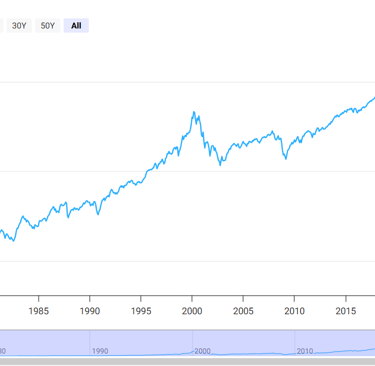
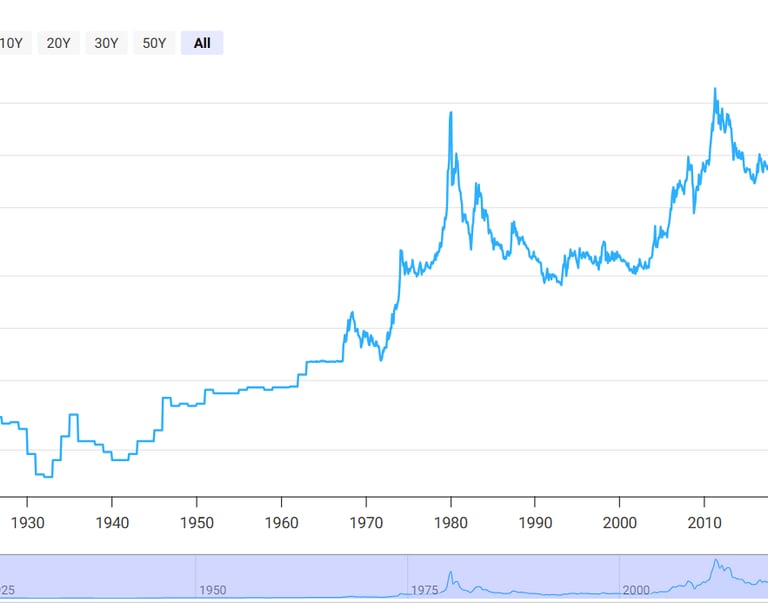
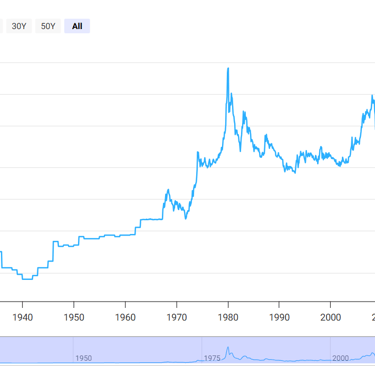
Explore elegant charts that visualize historical price movements effectively.
PS500 historical chart 1929-2025
Gold historical chart 1925-2025
Markets
We analyze and trade US500, NAS100, Silver, Gold, Bitcoin BTCUSD. Others can be included if there is special client interest


Nasdaq historical chart 1975-2025
Nasdaq historical chart 1975-2025
Frequently Asked Questions
What is US500 price chart?
It displays real-time price updates for the US500 index with daily and weekly highs and lows.
How do I receive alerts?
Clients receive live trading alerts directly to their devices for timely trading opportunities.
What are email notifications?
Email notifications inform you when prices reach your specified target levels for effective trading decisions.
How is price history visualized?
Price history is visualized using elegant charts for better analysis and understanding of market trends.
What markets do you cover?
We cover all index, commodities, and crypto markets using our mathematical trading methods.
How do I contact support?
You can contact support through our website's contact form or via our listed email and phone details.